Masters 1 (19 CPE)

Overview

Excel University Masters 1 teaches Power Query, Power Pivot, and Power BI. It demonstrates how to use these powerful tools to build the process that builds our reports (tables and graphs). We select the report and graph type based on Stephen Few's book, Show Me the Numbers. Plus, we incorporate his design practices to ensure effective communication. This course uses case studies to simulate real-world workbooks and projects. The final case study brings everything together as we build a dashboard to monitor our business. We complete each case study in both Excel and Power BI. There is also a library of Excel workbooks with reference charts. Check out the first video from the course below to learn more.


  • Table and Graph Topics

    • Display type: selecting a table or graph
    • Chart design practices
    • How to feature key relationships graphically
    • Nominal (order not important)
    • Ranking (order matters)
    • Part-to-whole (contributions to whole)
    • Time series (over time)
    • Distribution (distributed over range)
    • Deviation (difference)
    • Correlation (vary in relation to each other)
    • Geospatial (locations)
  • Power Query Topics

    • Get external data
    • Various transformations, including unpivot
    • Load to data model and table
    • Chain queries
    • Merge queries
  • Power Pivot Topics

    • Relationships
    • Measures (implicit / explicit)
    • Various DAX functions
    • Date (calendar) table
    • Data vs lookup tables
  • Power BI Topics

    • Getting external data
    • Modeling data and writing measures
    • Various visuals (matrix, table, column, bar, line, scatter, map)
    • Power BI desktop, service, mobile app
    • Slicers (and sync slicers)
  • Bonus Lesson

  • Author and Instructor

    Jeff Lenning CPA CITP
  • Subject

    Excel University Masters 1
  • Benefits

    Begin Now: begin training immediately
    On-Demand: train at your own pace
    Pause and Resume: pause and resume training as needed

  • Software

    Presented with Excel O365 and Power BI for Windows. Notes: Excel for Windows O365 is the recommended version for taking this course, however, these tools are also available for legacy versions of Excel starting with Excel for Windows (2010+). Excel for Mac is not supported.
  • Format

    On-Demand
  • Access Begins

    Immediately
  • Duration

    Work at your own pace during the one-year enrollment period.
  • Enrollment Period

    Your enrollment is valid for one year.

  • Lesson 1

  • Lecture Videos (minutes)
  • Overview (23m)
  • Power Query Intro  (21m)
  • Power Pivot Intro (21m)
  • Excel Reports Intro (16m)
  • Case Study 1 (29m)
  • Homework
  • Case Study 1
  • Additional Resources
  • Answer Files
  • Suggested Reading
  • Interactive Handout
  • Lesson 2

  • Lecture Videos
  • Case Study 2 - Excel (59m)
  • Case Study 2 - Power BI (27m)
  • Homework
  • Case Study 2
  • Additional Resources
  • Answer Files
  • Extra Credit Solutions (13m)
  • Related Blog Post
  • Lesson 3

  • Lecture Videos
  • Case Study 3 - Excel (45m)
  • Case Study 3 - Power BI (18m)
  • Homework
  • Case Study 3
  • Additional Resources
  • Answer Files
  • Extra Credit Solutions (6m)
  • Related Blog Post
  • Lesson 4

  • Lecture Videos
  • Case Study 4 - Excel (39m)
  • Case Study 4 - Power BI (15m)
  • Homework
  • Case Study 4
  • Additional Resources
  • Answer Files
  • Extra Credit Solutions (21m)
  • Related Blog Post
  • Lesson 5

  • Lecture Videos
  • Case Study 5 - Excel (28m)
  • Case Study 5 - Power BI (6m)
  • Homework
  • Case Study 5
  • Additional Resources
  • Answer Files
  • Extra Credit Solutions (21m)
  • Related Blog Post
  • Lesson 6

  • Lecture Videos
  • Case Study 6 - Excel (27m)
  • Case Study 6 - Power BI (7m)
  • Homework
  • Case Study 6
  • Additional Resources
  • Answer Files
  • Extra Credit Solutions (3m)
  • Related Blog Post
  • Lesson 7

  • Lecture Videos
  • Case Study 7 - Excel (10m)
  • Case Study 7 - Power BI (4m)
  • Homework
  • Case Study 7
  • Additional Resources
  • Answer Files
  • Extra Credit Solutions (5m)
  • Related Blog Post
  • Lesson 8

  • Lecture Videos
  • Case Study 8 - Excel (34m)
  • Case Study 8 - Power BI (13m)
  • Homework
  • Case Study 8
  • Additional Resources
  • Answer Files
  • Extra Credit Solutions (10m)
  • Related Blog Post

Materials

All course materials are provided digitally inside the course. There are no additional purchases required to complete the course.


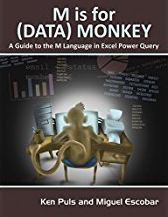
A digital PDF copy of M is for (data) Monkey by Ken Puls and Miguel Escobar is included in the course. You can download the eBook to keep as a permanent reference. The course teaches selected Power Query topics presented in the book. The book covers far more detail about Power Query, and provides an excellent resource to read during or after you work through the lessons.


For students looking to dig deeper into the topics presented, these books are suggested additional reading:


NASBA QAS CPE Microsoft Excel LogoObjectives

  • Recall which type of graph is useful to feature a given relationship (nominal, ranking, part-to-whole, time series, distribution, deviation, correlation, and geospatial)
  • Identify the Excel feature that summarizes values and displays them in rows and columns and includes totals
  • Recall which tool is designed to get and transform data
  • State the Excel feature that creates a graph
  • Recall which tool allows you to relate multiple tables and write measures for use in a report
  • Recognize that an explicit measure is written in Power Pivot
  • Recall which application incorporates the same technologies included in Power Query and Power Pivot

Program Level

Basic

Prerequisites

Although there are no course prerequisites, prior experience with traditional PivotTables is recommended.

Advance Preparation Needed

Ensure you have access to Excel for Windows (version 2010 or later), so that you can work through the homework exercises. Plus, you'll want to download Power BI desktop (free) if you want to work on the Power BI exercises. Excel for Mac is not supported.

Delivery Method

QAS Self-study

Recommended CPE Credits

19

Field of Study

Computer Software & Applications

Expiration

Program enrollment is valid for one year and participant must complete the final exam within this time period.

Registration

To register, add this course to your cart by clicking the Buy Now button and then complete the checkout process.

Refund Policy

Full 30-day refund; full refund for any course cancellations or registration into upcoming session if preferred.

Complaint Resolution

For information regarding adminstrative policies such as complaint resolution, please contact Jeff Lenning CPA CITP at 949-200-7688 or via email info@excel-university.com

Official Registry Statement

Excel University, Inc. is registered with the National Association of State Boards of Accountancy (NASBA) as a sponsor of continuing professional education on the National Registry of CPE Sponsors. State boards of accountancy have final authority on the acceptance of individual courses for CPE credit. Complaints regarding registered sponsors may be submitted to the National Registry of CPE Sponsors through its website: www.nasbaregistry.org.


Price: $287.00
Buy 2 or more for $229.60 each
Buy 20 or more for $143.50 each
Quantity: